The problem? You have a complicated group structure for your company, how does Room Hamburg relate to Floor Germany, where does Office England go, why are our computers in Office Tokyo inheriting a policy for a wallpaper showing Bratwurst Sausages.
How do we untangle the group and policy graph in entra?
While it’s a flat table, groups can have other objects as members. Working out what policy is inherited from what graph relationship is a huge chore, especially if you have a very large amount of groups.
You could just click through all the groups and their members and write it all down, but what a faff!
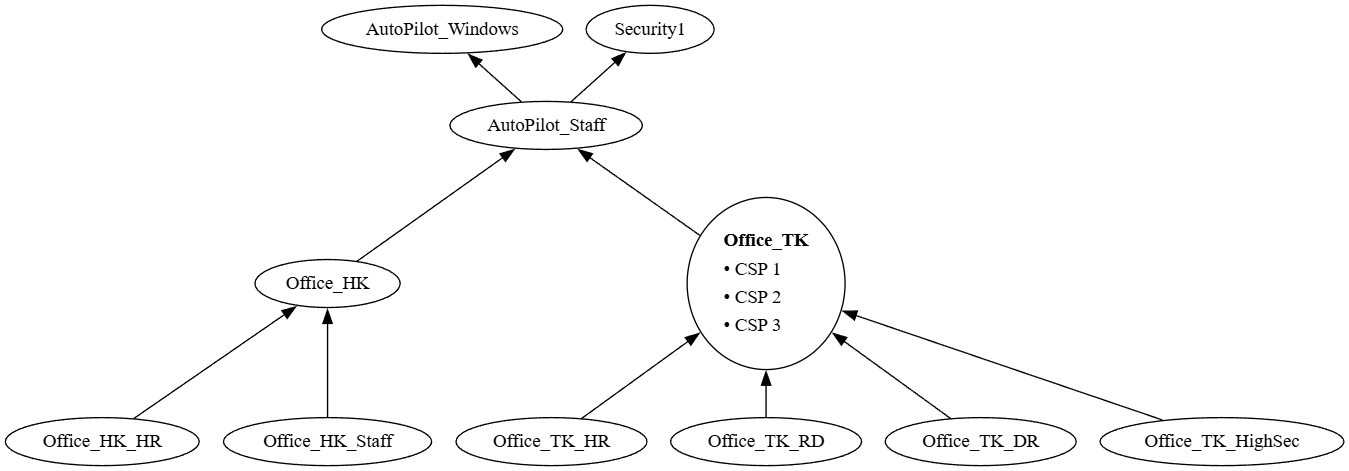
Instead, What if we get all the groups from entra, get all children of each group and build a GraphViz dot diagram to show the edge relationships!
In the following I will show how easy it is to graph the entity relationships in entra, dazzle your boss! Impress your manager!
1) Accessing the Data
Firstly we require the following tools:
- https://github.com/PowerShell/PowerShell
- Our chosen programming language – compatible with all Windows installations – other products are avaliable.
- https://www.nuget.org/packages/microsoft.graph
- The platform library for accessing the Microsoft Graph API.
- https://graphviz.org
- Our graph renderer library, capable of rendering various graph algorithms and lots of cool output formats!
- In this example we will be using the Dot function to get an image similar to the header image in this blogpost.